
Ocean Observations Data
Why are data, especially “Big Data”, important?
The Importance of Ocean Observations Data
Long story short, data are facts. Data offer proof that a particular thing–event, result, answer, condition…you name it–actually exists/happened.
Data define our past and the present moment, and they can also help us understand the probability of future events. The more information we have on trends and what’s happened over time, the more accurately we can forecast the future and prepare for it.
The technical definition of Big Data are huge sets of data encompassing long periods of time and lots of variables; analyzing them requires mucho server space and computing power. We love Big Data because with the right tools, we can extract so much useful information from it. Big Data’s not just a set of nice earrings; it’s the whole goldmine.
And guess what generates a lot of Big Data? OBSERVING THE OCEAN.
Using big data to track big changes
The ocean ecosystems of the Northeast Atlantic, especially within the Gulf of Maine, are changing faster than almost anywhere else in the world, and we’ve got the ocean observation data to prove it. The absorption of carbon dioxide (CO2) from the atmosphere into the ocean is driving ocean acidification (oa) and marine heatwaves. Some animals like white sharks are altering their behavior to adapt to warmer waters, while less mobile creatures such as scallops and oysters might not survive these significant temperature shifts.
These examples barely scratch the surface of the oceanographic and biological shifts that are underway, and which continue to be extensively studied. (And there’s so much more to look at. Everyone, go do science!) These data are useful for many things besides ruining your week: the conclusions we can draw from trends in data make it possible for us to respond in meaningful ways. To illustrate, if we were to determine that a warmer Gulf of Maine might change the way ships transit from here to the Arctic, then we could get in front of that change by adding observing assets farther north, averting maritime disasters *before* they happened. Thanks, Big Data!
How many pieces of data does NERACOOS have? (Hint: 9 figures)
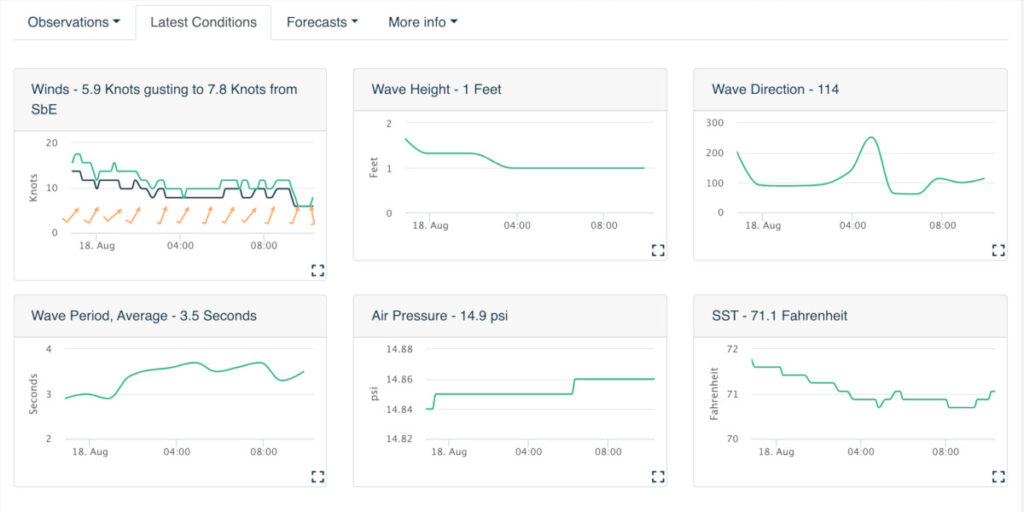
The network that would eventually become NERACOOS first started producing ocean data in 2001. It’s hard to quantify just how much data we’ve integrated since then. Consider that each buoy in the NERACOOS network sends hourly updates on several different parameters, sometimes at multiple depths. For example, Buoy A reports on more than 50 variables 24 times a day, while the Buzzards Bay CMAN station (a NDBC buoy) reports on 5 each hour. In 2021, there are close to 70 assets delivering data through the Mariners’ Dashboard, up from the original 13 at the time of NERACOOS’s founding.
We deliver (at least) 21,509 observations every day from buoys operated by UMaine, UConn, URI, UNH, NDBC and NERRS. That’s 7,850,785 observations each year!
We’ve increased the amount of data we deliver over the years, so to account for prior years, let’s assume that back in 2001, we delivered 5,000 observations per day, or 1,825,000 yearly, and every year since 2001 (at the time of this writing it’s 2021) we’ve steadily increased the number of daily observations to their current level. By that count, we grew 16.5% every year for 20 years to get to our current number of daily observations. That means from 2001 to 2021 we have delivered more than 100,000,000 observations. Final Answer: ONE HUNDRED MILLION!
We invite you to explore and put our data to use!
Visit our ERDDAP server to access all 100,000,000 (and growing) NERACOOS observations.

